Sankey
Sankey diagrams are diagrams used to visualize the flow of matter, energy, or information, and they are especially useful for showing the flow relationship between different components in a system. Sankey diagrams are composed of elements such as nodes, connecting lines, flow, text labels, and a legend, which help readers understand and analyze flow relationships. Sankey diagrams are widely used in various fields such as energy, environment, economics, and transportation to display flow information.
Application scenario
- Business: to visualize the flow of products, services, and money within a company, and to identify potential areas for improvement.
- Energy: to represent the flow of energy in a system, such as the energy consumption and production of a power plant.
- Environment: to display the flow of waste and resources in a region or community, and to identify opportunities for reducing waste and increasing resource efficiency.
- Economics: to display the flow of goods, services, and money in an economy, and to understand how different components of an economy are interconnected.
- Transportation: to visualize the flow of passengers and goods in a transportation system, and to identify opportunities for improving transportation efficiency.
- Supply Chain: to represent the flow of materials, information, and money in a supply chain, and to identify opportunities for improving supply chain performance.
Composition
- Nodes: represent the starting and ending points of flow, usually represented as a band with unequal widths.
- Connecting lines: represent the flow direction, used to connect two nodes, and the width of the connecting lines represents the flow size.
- Flow: represents the flow of matter, energy, or information, usually expressed in quantity or proportion.
- Text labels: represent explanations for nodes or flow, used to explain the meaning and quantity of flow.
- Legend: used to explain the meaning of flow colors and line thickness, etc., helping readers better understand the information in the Sankey diagram.
Example
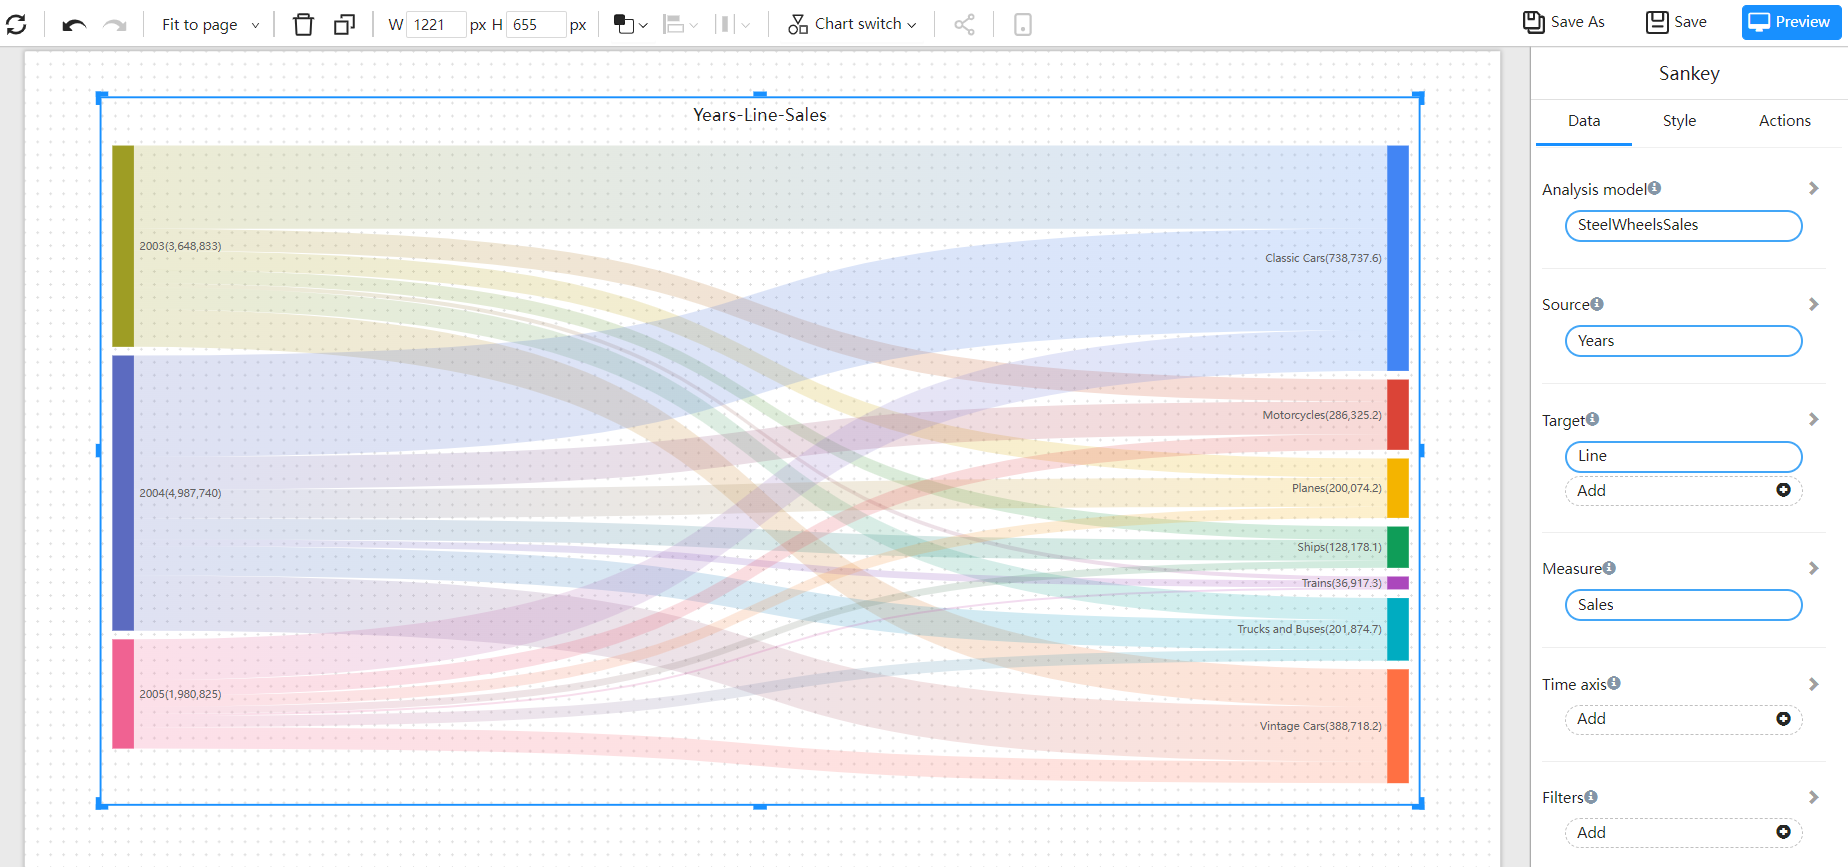
Data flow direction and size between two dimensions.

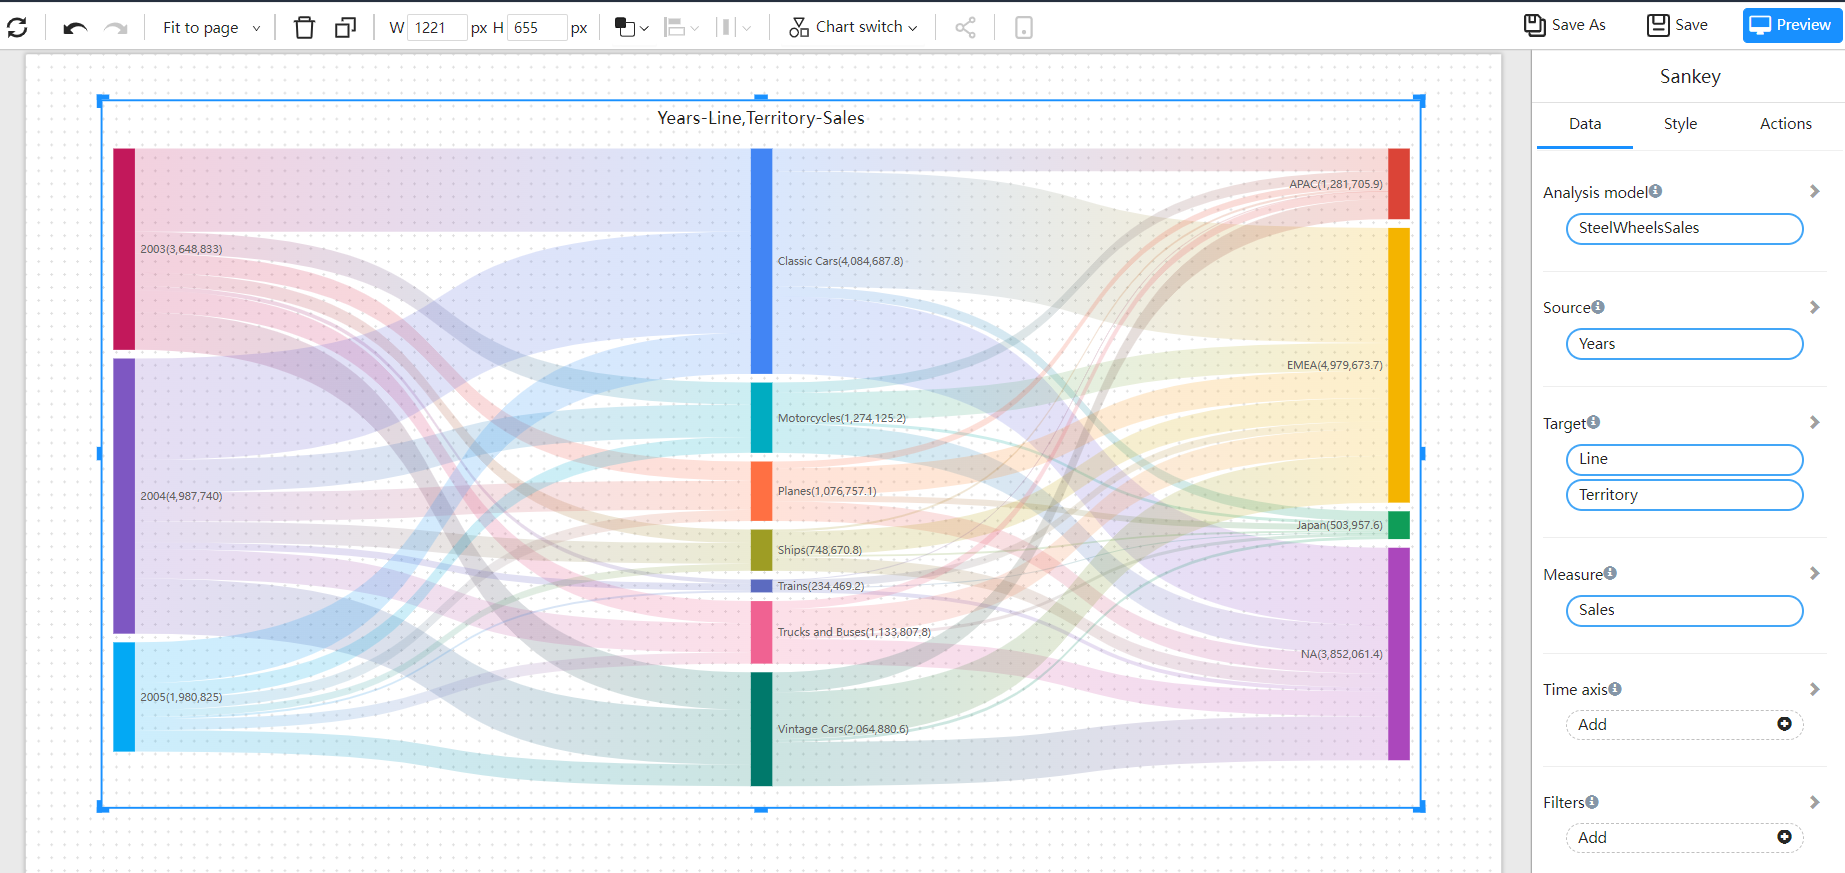
Data flow direction and size among three dimensions.
